
Efficiency & Emissions
PrintPursuing carbon neutrality and deploying connectivity solutions that support cost savings, efficiency, innovation and emissions reductions.
Click through to learn about our 2025 impact in action. For detailed data, please see our 2025 data tables.
For information on how we calculate our emissions see the AT&T Basis of Calculations of Greenhouse Gas Emissions Data.

Our Approach
Our Approach
At AT&T, we focus on emissions reductions that benefit the company, the communities we serve, our customers and our suppliers. We are also enhancing the resilience of our network operations and the communities in which we operate.
In 2020, we committed to Scope 1 and 21 carbon neutrality across our global operations by the end of 2035; in 2021, we set an interim target that was approved by the Science Based Targets initiative (SBTi) and aligns with a 1.5°C pathway.
To assess and reduce our impact, including related impacts on our operations, we focus on:
- Lowering emissions
- Building resilience
- Seizing opportunities
1. Lowering Emissions
We minimize our emissions through financially prudent approaches, targeting continuous improvements through:
- Energy efficiency projects and network optimization efforts
- Renewable energy procurement
- Optimizing fleet productivity
Though we aim to reduce emissions as much as possible, there may be some sources that cannot be eliminated. In these cases, we may, in the future, invest in carbon offsets. We are committed to pursuing credible offsets and being transparent in our approach. To date, offsets are not included in our carbon footprint.
Energy Efficiency and Network Optimization
We drive operational and network energy efficiencies, updating systems and decommissioning obsolete assets to reduce annual energy consumption. A key part of our energy efficiency strategy includes our transition from copper-based networks to faster, more efficient fiber optic cables that reduce energy use and associated emissions. We also conduct proof-of-concept trials and implement technology-enabled solutions across our facilities and network that can deliver scalable energy savings.
To understand current performance, we use AT&T connectivity and Internet of Things (IoT) technologies to acquire data from facility equipment and network assets. We analyze this data to set baselines and monitor equipment status in real time to identify opportunities for reducing costs and unnecessary energy use.
Renewable Energy Procurement
Recognizing that Scope 2 emissions (from purchased electricity) account for most of our operational emissions (Scope 1 and 2), we strive to meet more of our energy needs with renewable sources. We continue to explore beneficial large-scale renewables opportunities and have begun exploring battery energy storage systems (BESS) agreements. Through Virtual Power Purchase Agreements and BESS, AT&T believes we can help spur additional renewable energy, reduce energy costs, stabilize the grid and reduce our carbon footprint.
Learn more about our energy efficiency efforts and renewable energy use in our Energy Management issue brief.
Low-Carbon Fleet
Our ground fleet constitutes the largest proportion of our Scope 1 emissions. We aim to reduce fleet emissions by at least 76% by 2035 by optimizing our vehicle inventory and driving more efficient vehicles. We also reduce fleet emissions through our network transformation, requiring less maintenance and fewer dispatches, therefore reducing the size of our fleet. Through membership in the Corporate Electric Vehicle Alliance, we are identifying opportunities to add electric vehicles (EVs) to our fleet while addressing wider challenges to adoption.
Scope 3 Emissions
Scope 32 emissions are our largest single emissions source. We collaborate with key suppliers to help them set and make progress against their own emissions reduction goals.
Learn more about our Scope 3 emissions categories.
2. Building Resilience
Keeping our network and operations up and running is critical to the millions who rely on AT&T connectivity. That’s why we’re assessing, managing and working to reduce the potential impacts and magnitude of risks on our operations.
AT&T integrates advanced data into decision-making processes to help protect our business and infrastructure against severe weather-related impacts. We assess how regulations, technology developments and market or reputational factors could affect our company. Where relevant, we integrate identified impacts into our Enterprise Risk Management (ERM) process, which is described in our Ethics & Integrity issue brief.
Scenario Analysis
In 2025, we enhanced our scenario analysis to align with our assessment of internal thresholds and Task Force on Climate-related Financial Disclosures (TCFD) recommendations. This process included benchmarking top risks and opportunities specific to AT&T and measuring progress toward our public goals. We also evaluated the effectiveness of our risk mitigation strategies and deepened our understanding of AT&T’s sensitivity and adaptive capacity to address the risks and opportunities most critical to our business.
For more information, see our TCFD Report.
Physical Risks
We conduct regular analysis and implement solutions to help verify that our network infrastructure, such as cell sites, are well positioned to withstand natural disasters and other environmental factors, including coastal flooding and droughts due to extreme weather. We consider long-term projected impacts and seek new ways to integrate data into planning systems to inform infrastructure decisions.
Our 2025 climate survey results provide further insight into these risks. The strength of our adaptive capacity to extreme weather and physical climate risk tied to material sourcing reduces overall risk to low. This means that, even where potential vulnerabilities exist, AT&T’s robust preparedness and response strategies enable us to effectively manage and mitigate these challenges, resulting in a lower overall risk rating.
Learn more about how we’re building resilience to such impacts in our Network Resilience issue brief.
Transition Risks
We are exploring both the potential risks and opportunities to AT&T associated with a lower-emissions economy. For instance, changes in federal, state and foreign government regulation could increase compliance, operating and capital costs and may elevate legal or litigation risk. Our top potential transition risks include disruptions in access to raw materials from our suppliers and large-scale renewable energy.
Resilient Communities
Our Resilient Communities Initiative helps local governments incorporate forward-looking data into hazard mitigation and resilience planning. By applying ClimRR Portal insights, communities can assess potential local impacts from extreme heat, flooding, dangerous fire-related weather conditions and drought.
We created the ClimRR Portal with the U.S. Department of Energy’s Argonne National Laboratory. The portal provides cutting-edge, localized projections based on underlying datasets containing over 60 variables to project future hazards like extreme heat, heavy rainfall and wildfire.
ClimRR helps improve America’s preparedness for extreme weather events, making some of the country’s most sophisticated modeling freely and publicly accessible so individuals, governments and organizations can explore localized data on future risks to inform resilience strategies.
3. Seizing Business Opportunities
In 2021, we launched the Gigaton Goal to deliver connectivity solutions that help enable business customers to reduce their energy consumption and expenses, and to collectively save a gigaton (1 billion metric tons) of GHG emissions between 2018 and 2035.3 To achieve this ambitious target, we are developing Gigaton Pathways that integrate AT&T Fiber, 5G and IoT with complementary technologies that help companies operate more efficiently and develop new technologies that drive down costs and stimulate business innovation.
We are focused on Gigaton Pathways that can enhance efficiency for our business customers and foster growth of new, emissions-reducing industries in six key areas:
- Smart Buildings: Connect building equipment to drive energy efficiency.
- Transportation: Enable more efficient operation of existing transportation and the advancement of emerging transport solutions.
- Renewable Energy and Storage: Provide critical connectivity to deliver, optimize and store renewable energy.
- Methane Waste to Value: Reduce methane leaks and support the conversion of methane to valuable products with help from connectivity.
- Carbon Removals: Monitor facilities and capture data needed for credible measurement, reporting and verification of carbon removals.
- Industrial Technologies: Enable smart, efficient manufacturing and logistics for a wide range of industrial products.
We work with The Carbon Trust to develop emissions abatement factors representing the average emissions reduction that can be achieved through the Gigaton Goal.
Learn more about our Gigaton Goal in our progress update. To explore how we measure our impact, visit our 2025 Gigaton Methodology.
Efficiency and Emissions Governance
We have assigned oversight responsibility to several internal bodies.
- Board of Directors Governance and Policy Committee (GPC): Oversees and provides guidance and perspective, as deemed appropriate, to the Board and management on corporate responsibility (CR) strategy, policies, programs and reporting. Our Head of CR and other senior leaders present at GPC meetings throughout the year. Materials and discussions include but are not limited to digital divide, privacy, environmental stewardship, CR reporting and political and charitable contributions.
- Corporate Responsibility Governance Council: Comprises executive leaders responsible for business areas most closely linked to our corporate responsibility priorities.
- Head of Corporate Responsibility: Oversees AT&T’s strategy, receiving regular updates on cross-company activities and developments.
- Assistant Vice President (AVP) of Global Environmental Sustainability: Reporting directly to the Head of Corporate Responsibility, oversees AT&T’s environmental programming and leads our Environment Committee.
- Environmental Sustainability Team: Led by the AVP of Global Environmental Sustainability, monitors internal and external developments and communicates relevant issues to the Head of Corporate Responsibility. The team works with business unit experts to implement and enhance programs and policies addressing environmental risks and opportunities.
- Senior Vice President of Engineering and Operations: Is responsible for network resilience, including energy and water use. Oversees our commitments to renewable energy procurement, energy efficiency, network disaster response and business continuity planning.
- AT&T Implementation, Provisioning and Optimization: Sits in our Network Engineering and Operations organization and oversees business activities that impact emissions, such as energy efficiency, energy conservation measures, decommissioning activities and renewable energy purchases. Other measures affecting emissions, such as our fleet, are managed within distinct departments in accordance with organizational procedures.
For more information on our oversight of these issues, please visit our TCFD Report.
Robust Management and Policies
Robust policies and procedures guide how we manage risks and opportunities related to energy and emissions, including: the AT&T Environmental Statement, which addresses our approach to managing impacts, reducing emissions, increasing operational resilience and helping customers pursue sustainability.
To keep pace with the evolving sustainability landscape and scope of our company, we continuously evaluate, revise and look for ways to strengthen our GHG emissions management program in line with relevant standards, protocols and best practices. We work with an integrated energy services provider to compile, analyze and produce our annual emissions statement. We review content and methods related to data calculation, estimation and aggregation annually to identify improvement opportunities.
We’re also automating emissions data collection and calculations associated with our annual emissions statement to reduce data collection and processing time, accelerate data validation and decrease the likelihood of human error.
Stakeholder Engagement
We partner with industry peers, governments, nonprofits and academia who are equally committed to creating a more resource efficient, more sustainable world, including:
- Clean Energy Accounting Project (CEAP): AT&T sits on the Advisory Council for CEAP, which is working to develop clean energy and GHG emissions accounting guidance.
- Corporate Energy Buyers Alliance (CEBA): AT&T is a member of CEBA, a community of corporate energy buyers and partners working to advance clean energy systems.
- Center for Climate and Energy Solutions (C2ES): AT&T supported C2ES in developing a multi-stakeholder-led framework for business leadership on resilience. We also supported C2ES to develop and launch their Principles for Corporate Climate Resilience Leadership.
- The Conference Board (TCB): AT&T is a member of TCB, a global, nonprofit think tank and business membership organization whose research and policy statements help leaders address their most important business issues.
- Corporate Electric Vehicle Alliance: AT&T is a member of the Corporate Electric Vehicle Alliance to understand and support the transition to EVs across various use cases and class sizes.
- Global enabling Sustainability Initiative (GeSI): AT&T participates in GeSI projects and activities in the areas of climate, supply chain and human rights.
- Interdependent Networked Community Resilience Modeling Environment (IN-CORE): AT&T supports IN-CORE, which provides expertise in community resilience, as we grow the user base and awareness of the ClimRR Portal.
- Sustainable Brands Member Network: AT&T is a member of Sustainable Brands, a community of companies focused on sustainable innovation.
- Third Derivative: AT&T collaborates with Third Derivative to identify emerging technologies that either can use AT&T connectivity to join our Gigaton Pathways program, or can be deployed within AT&T to reduce our own operational emissions.
We are also members of trade associations that support initiatives aligned with our decarbonization commitments, such as the Business Roundtable and the U.S. Chamber of Commerce.

Impact in Action
Our 2025 Impact in Action
| Topic | Goal | Progress |
|---|---|---|
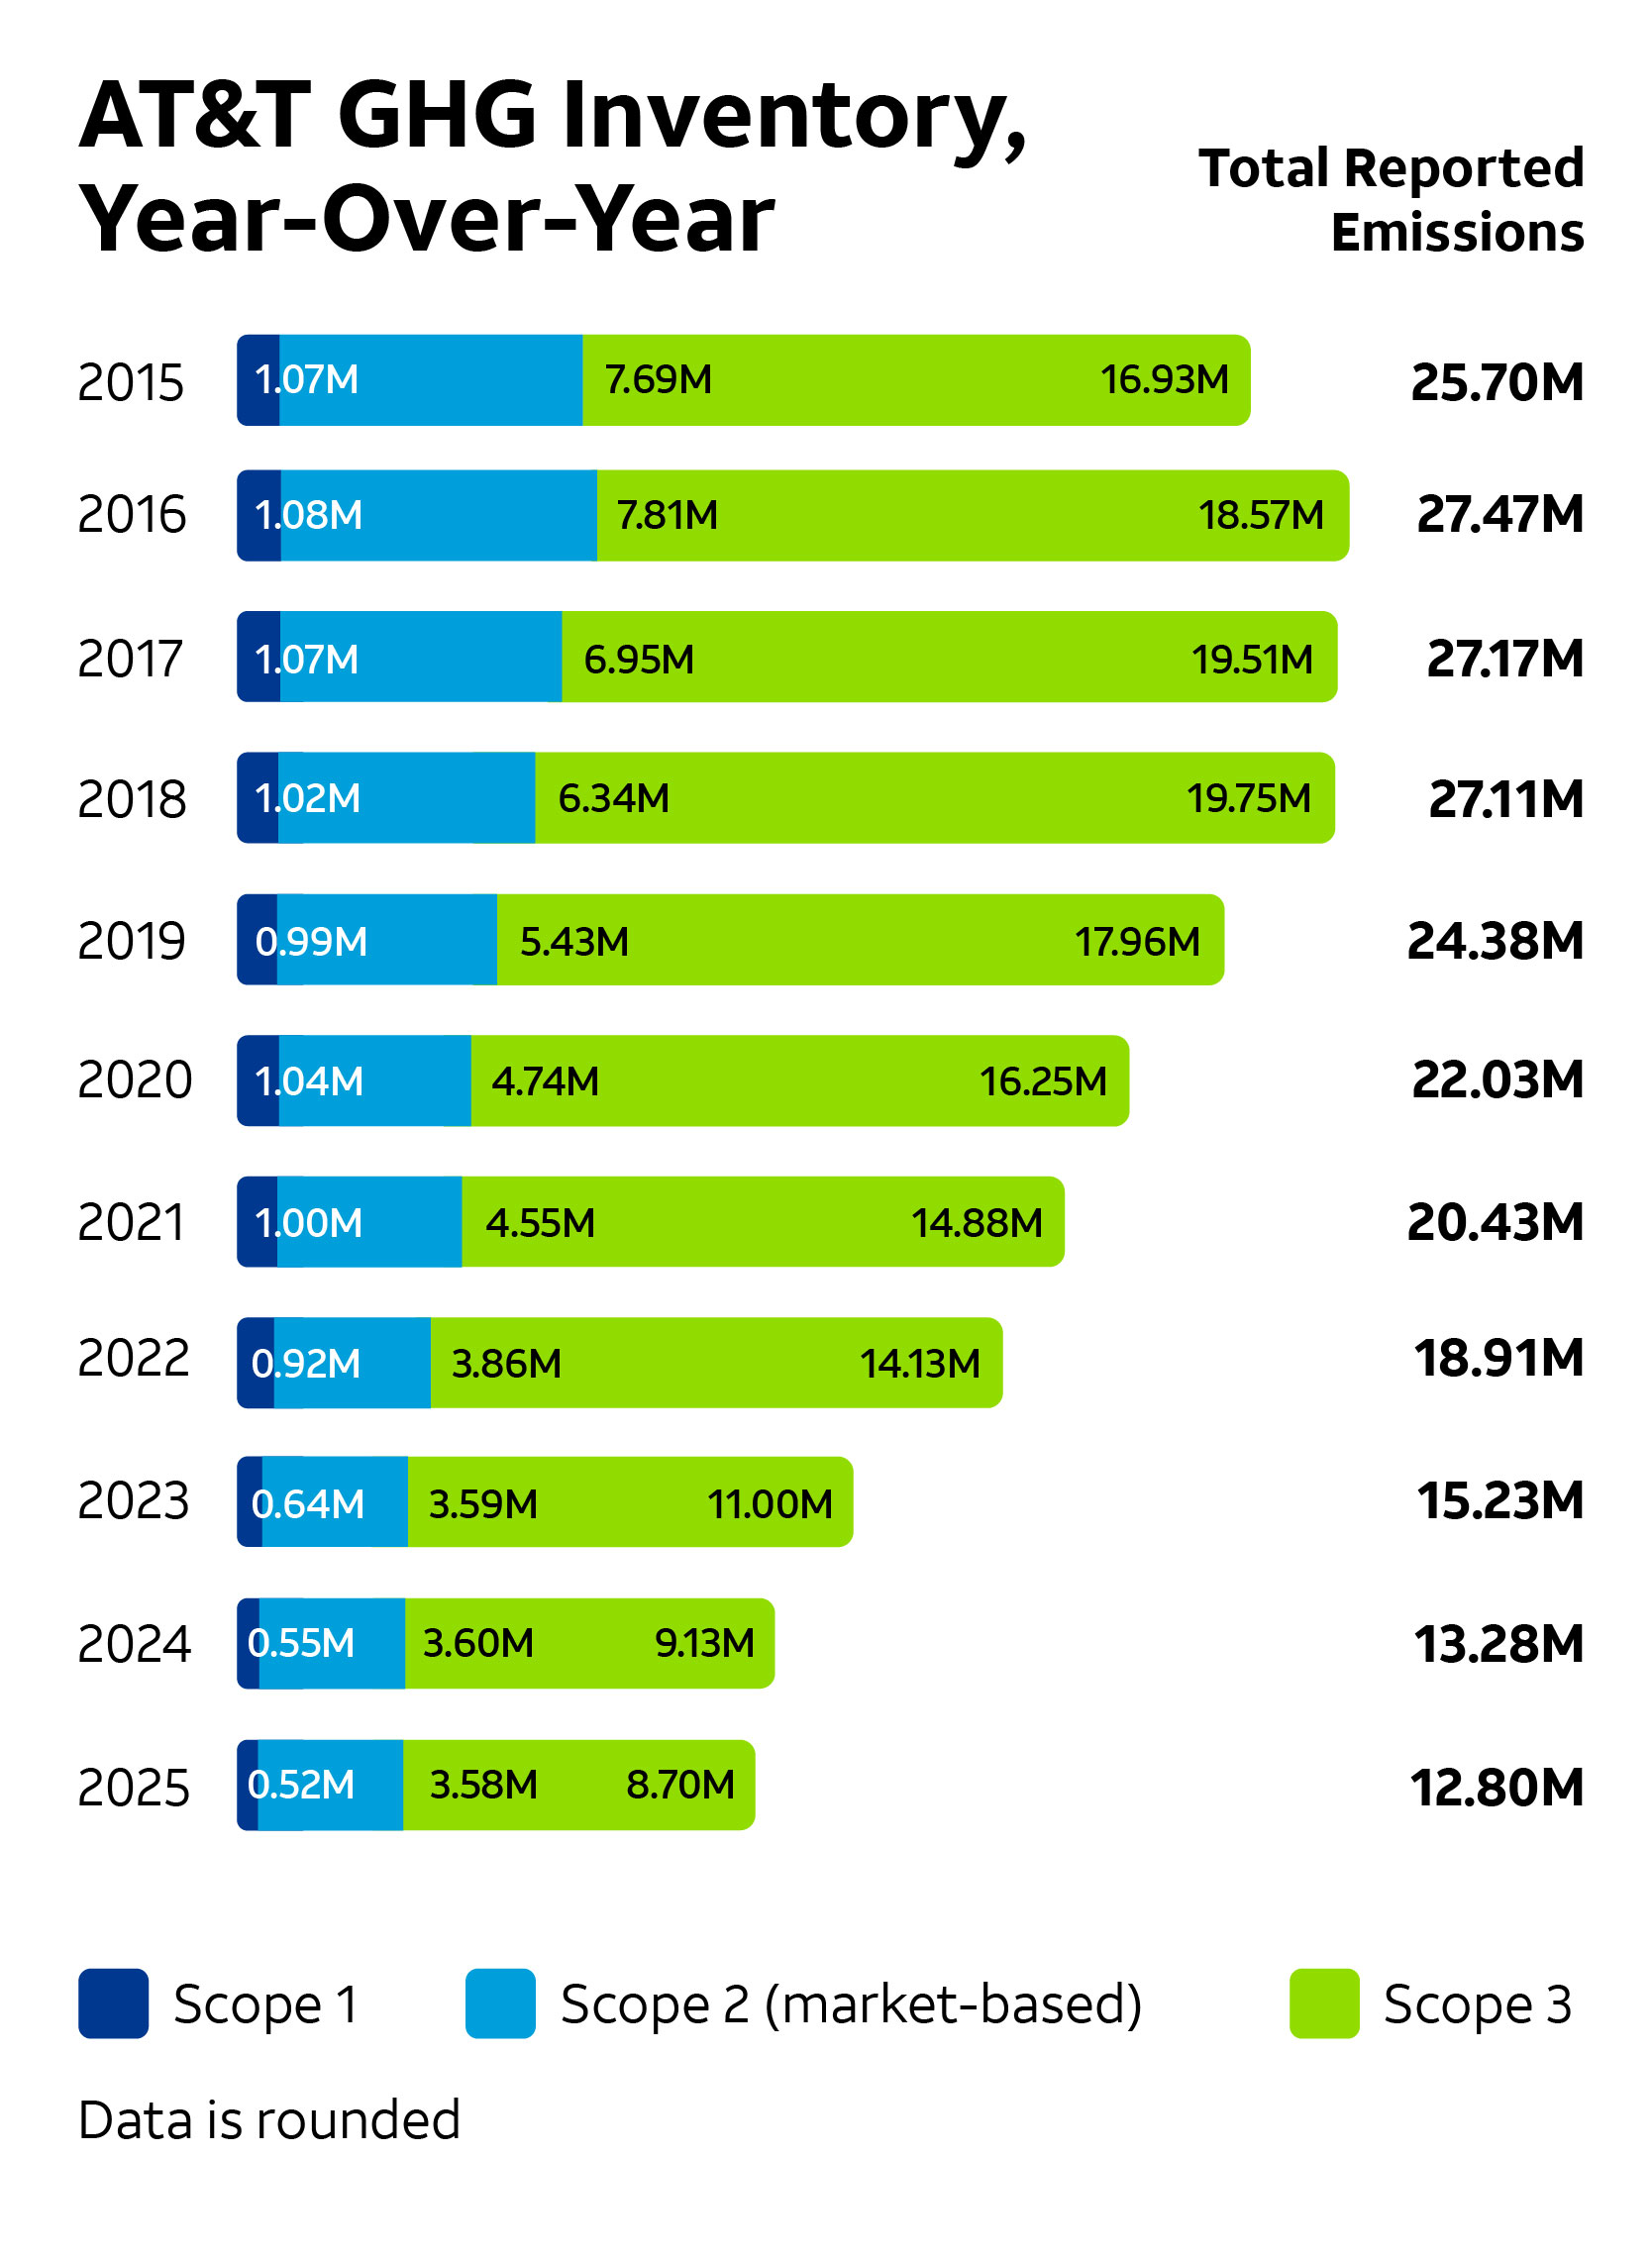
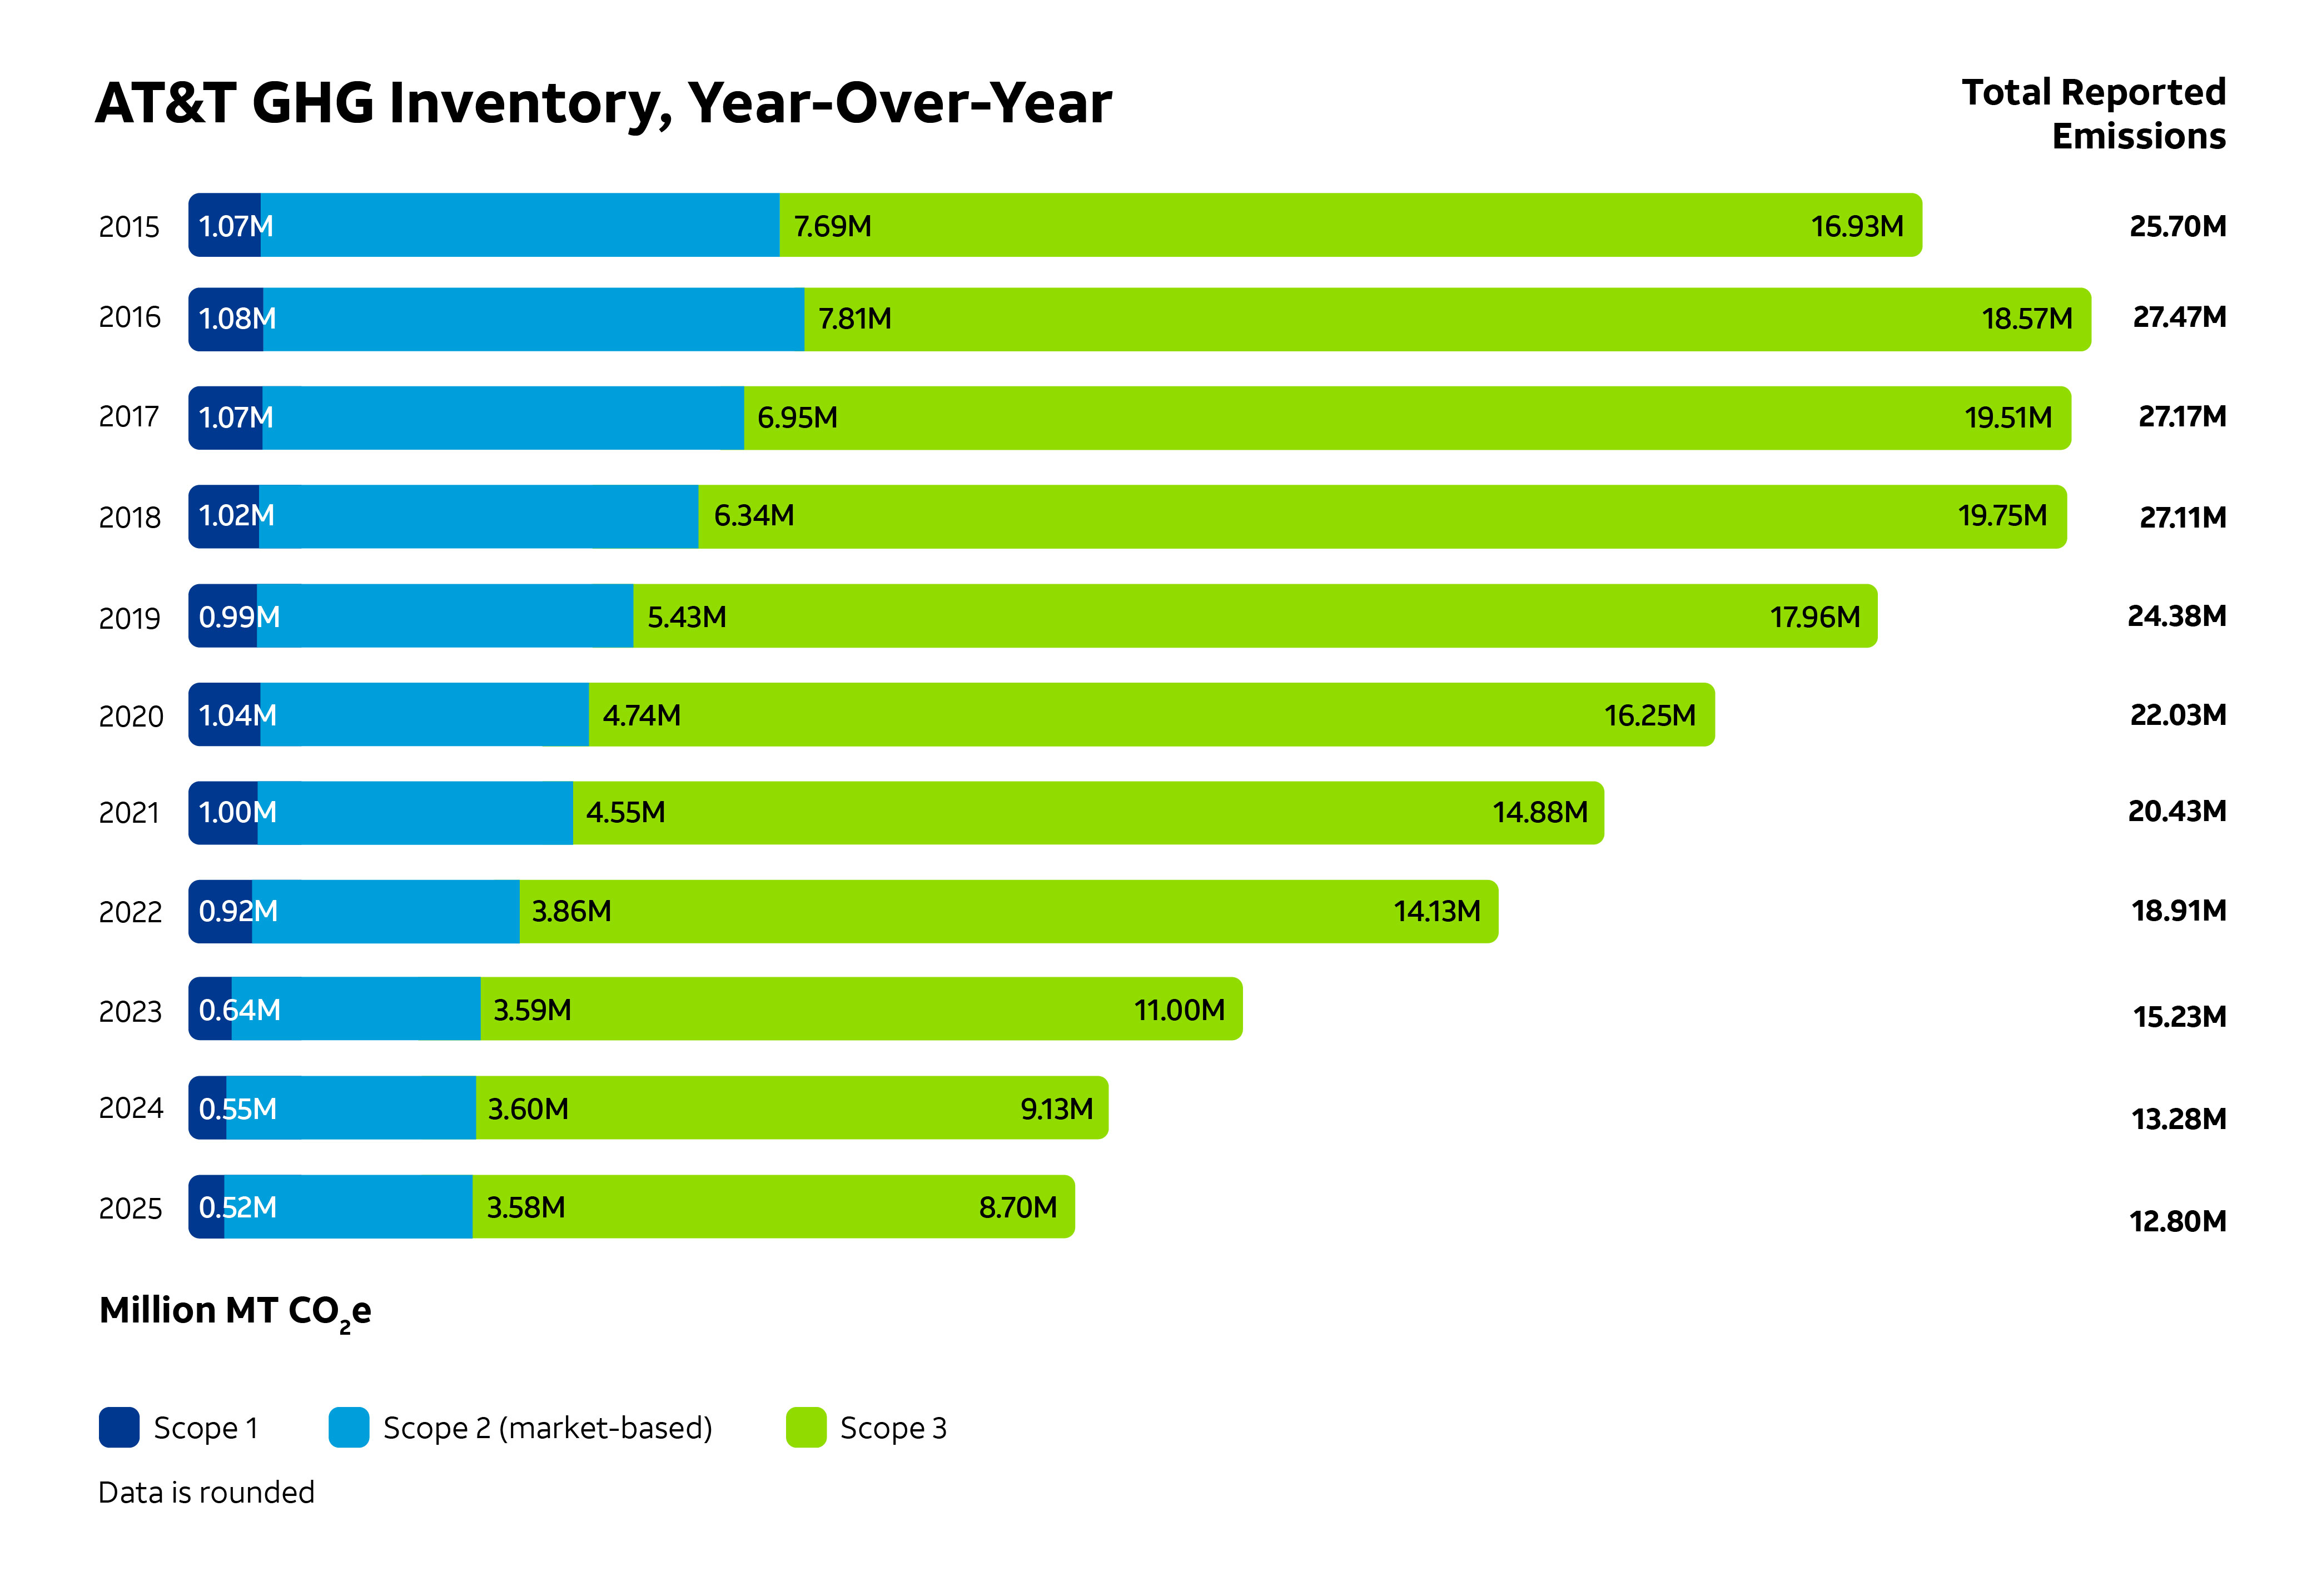
| GHG Emissions | Reduce our absolute Scope 1 and 2 GHG emissions by 63% (2015 base year) — aligning with a 1.5°C pathway by the end of 2030.4 | Reduction of 57% from our 2015 base year (8.8 million metric tons of CO2e) a 90% attainment toward our Scope 1 and 2 science-based target. |
| Carbon Neutrality | Achieve carbon neutrality (Scope 1 and 2 emissions) by the end of 2035. | Reduction of more than 5.0 million metric tons CO2e from our 2015 base year, a 57% attainment toward our carbon-neutrality target. |
| Customer Emissions Reduction Enablement | Deliver connectivity solutions that enable business customers to reduce a gigaton (1 billion metric tons) of GHG emissions from 2018 through the end of 2035. | Enabled 327.9 million metric tons of customer emissions savings, 33% of our Gigaton Goal. |
Tackling Our Emissions
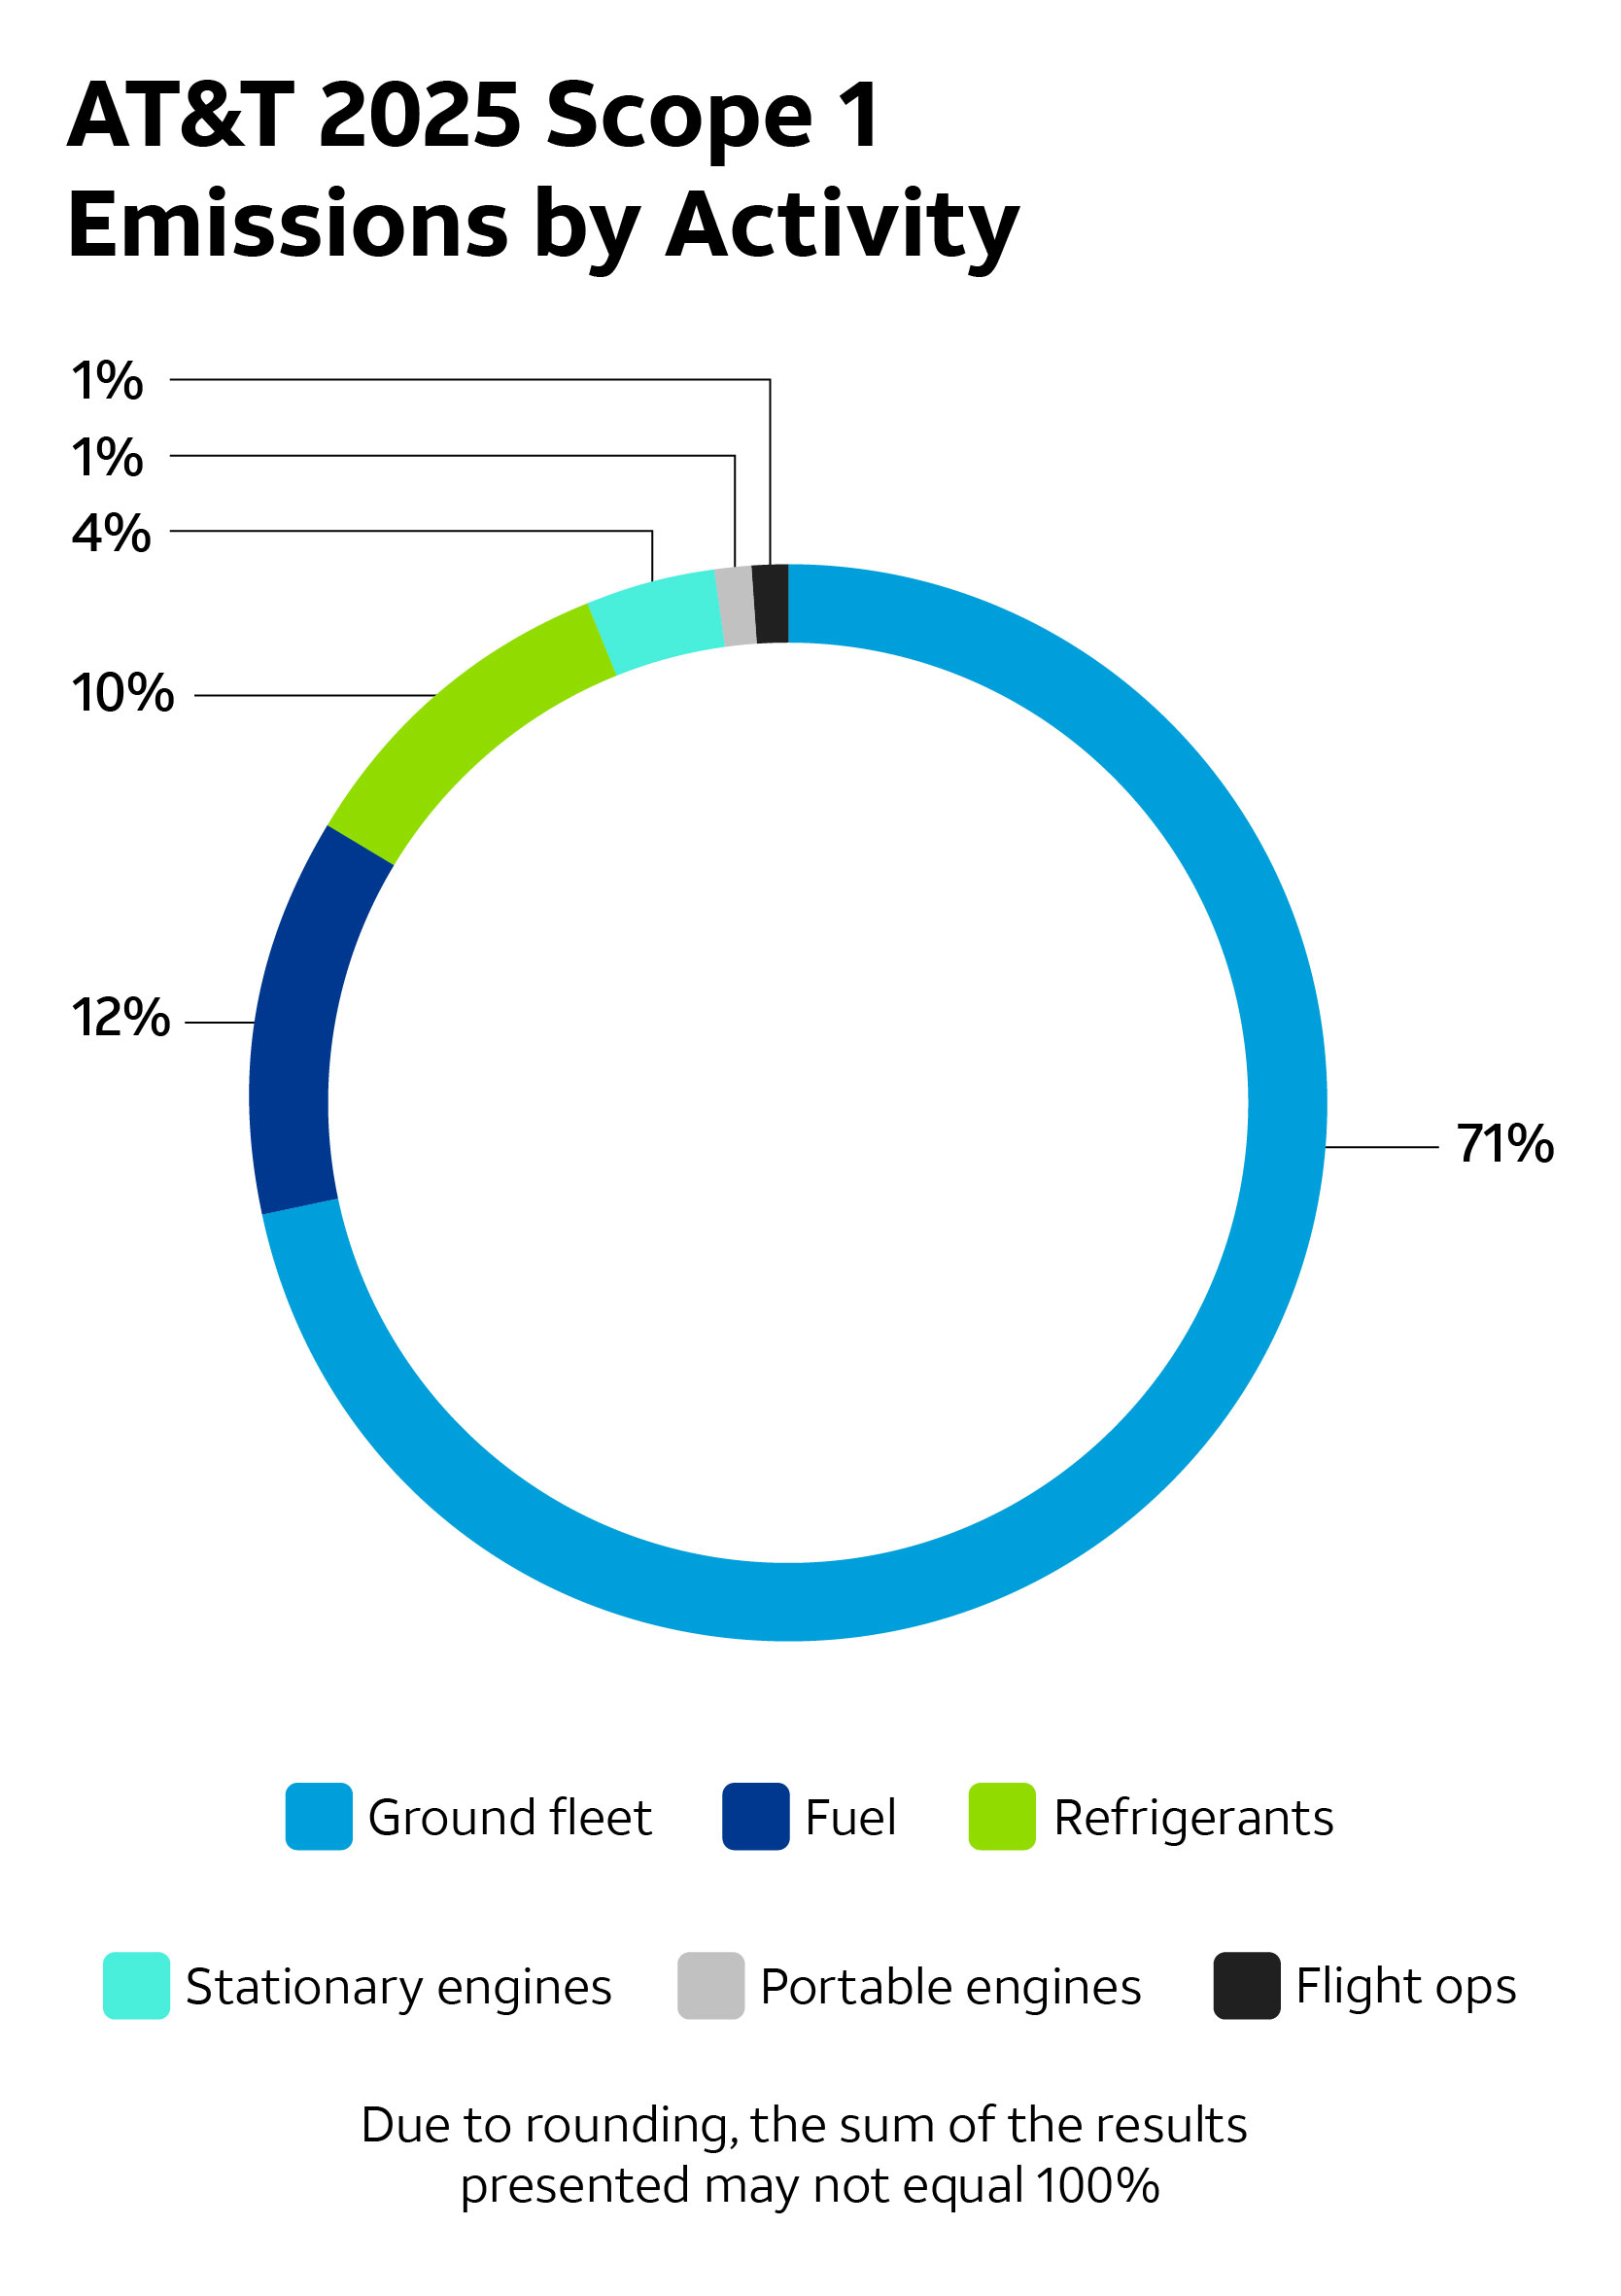
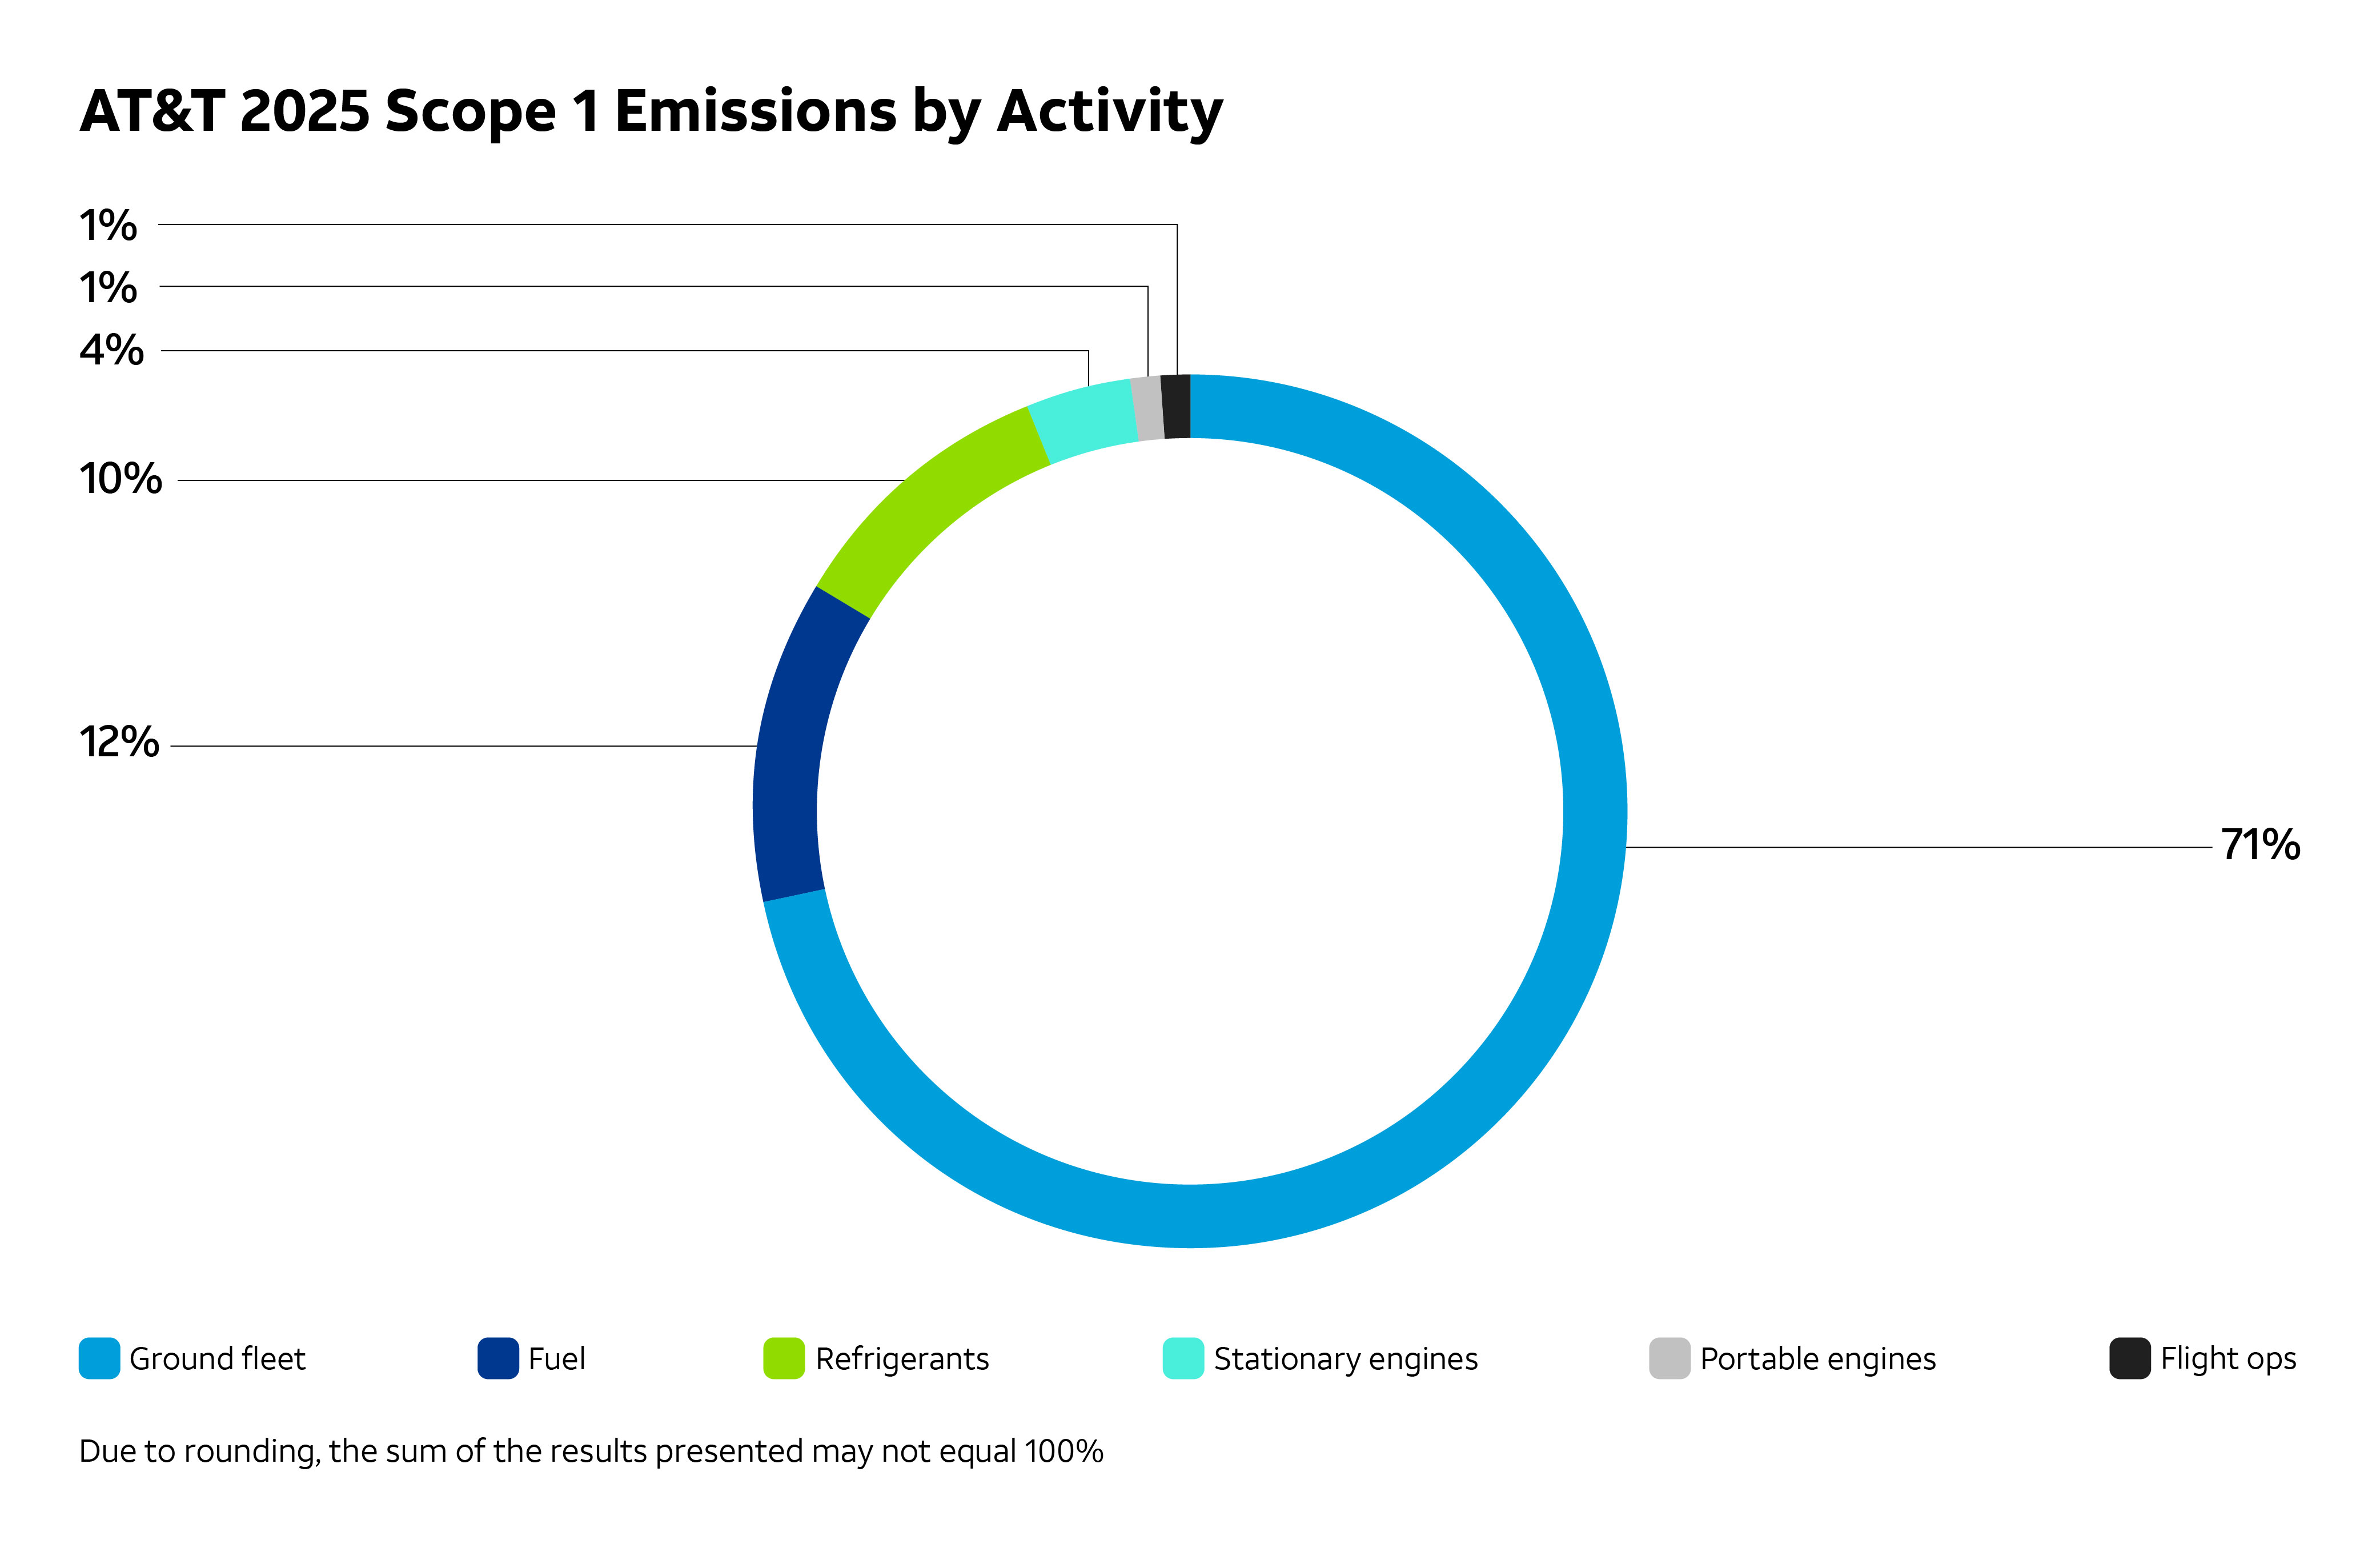
Our ground fleet emissions accounted for 71% of our 2025 Scope 1 emissions, while approximately 86% of total operational emissions were attributable to purchased electricity. In 2025, we entered one new contract to purchase renewable energy. We also conducted nearly 933,800 projects to enhance energy efficiency. For more information, see our Energy Management issue brief.
Scope 1 (Direct) Emissions
Scope 1 emissions account for 4.5% of our total reported emissions and 13.7% of our total operational emissions.5
FY25 % of Total
Fleet
We are reducing our overall fleet, with the goal of reducing our fleet emissions by at least 76% by 2035. In 2025, our fleet emissions decreased by 459,700 metric tons of CO2e, or approximately 55% from our 2015 base year. This figure represents a year-over-year decrease of approximately 15,800 metric tons of CO2e, or nearly 4% from 2024. The year-over-year reductions are largely a result of accounting for the biogenic emissions associated with the consumption of gasoline which contains ethanol. AT&T’s Scope 1 biogenic emissions for 2025 were 24,486 metric tons of CO2e.
In addition, our transition from a copper- to a fiber-based network requires less maintenance due to more efficient fiber optic cables, resulting in fewer service visits by technicians. At the same time, we expanded our EV fleet where feasible, investing in charging infrastructure and retiring older vehicles. In response to California’s Advanced Clean Fleets regulation that requires that at least 10% of fleet vehicles be zero-emission or near-zero-emission vehicles, we built out two EV depot hubs in South California, each designed to support approximately 25 technician vans.
Scope 2 (Indirect) Emissions
As part of our overall 2035 carbon neutral goal, we are aiming to reduce our Scope 2 (indirect) GHG emissions by over 90% by 2035 from 2015. Scope 2 emissions account for 28% of our total reported emissions. Our Scope 2 emissions decreased by approximately 8% from 2024 to 2025, a nearly 57% overall reduction from our 2015 baseline. AT&T reports market-based Scope 2 emissions in accordance with the Greenhouse Gas Protocol, enabling us to account for renewable electricity in our portfolio.
Purchased electricity represents our greatest opportunity for emissions savings. We have multi-year transition plans in place to reduce electricity consumption where possible and accelerate energy efficiency efforts. Read more about our 2025 progress in the Energy Management issue brief.
Scope 3 Emissions
In 2025, Scope 3 emissions represented 67.1% of our total footprint. Our Scope 3 emissions decreased by 8% from 2024 to 2025. AT&T restated our 2024 Purchased Goods and Services to reflect a spend categorization change relating to land leases. This resulted in Purchased Goods and Services only seeing a 3.4% decline in emissions from 2024 to 2025. The most impactful reduction was the divestiture of DIRECTV in Category 15 - Investments, which saw a 98% reduction in emissions. When excluding Investments, AT&T saw an increase in Scope 3 emissions of 3.6%, largely due to increases in Employee Commuting, Capital Goods and Fuel and Energy-Related Activities.
We report on Scope 3 emissions categories that are relevant to our business. Learn more about our Scope 3 emissions categories in our 2025 Scope 3 Emissions Categories document.
| Scope 3 Emissions Sources (MT CO2e) | FY25 |
|---|---|
|
Category 1: Purchased Goods and Services |
2,836,562 |
|
Category 2: Capital Goods |
2,214,103 |
|
Category 3: Fuel and Energy-Related Activities6 |
989,006 |
|
Categories 4 & 9: Upstream and Downstream Transportation and Distribution |
105,733 |
|
Category 5: Waste Generated in Operations |
78,884 |
|
Category 6: Business Travel |
54,746 |
|
Category 7: Employee Commuting |
463,597 |
|
Category 11: Use of Sold Products |
325,923 |
|
Category 13: Downstream Leased Assets |
745,741 |
|
Category 15: Investments |
17,643 |
We obtained annual, limited independent assurance of our Scope 1, 2 and 3 emissions in accordance with the International Standard for Assurance Engagements 3000 (Revised). The rigor of this process helps us realize year-over-year improvements in accuracy.7 Learn more in the 2025 Independent Limited Assurance Report and explore our emissions data in our 2025 data table.
Delivering Emissions Reductions through Gigaton Pathways
As of the end of 2025, emissions reductions enabled by AT&T connectivity since the Gigaton Pathways program was developed were 327,920,036 metric tons of CO2e, representing 33% of our Gigaton Goal.
In 2025, we identified six Gigaton Pathways that focus on areas where we believe connectivity plays a fundamental role in enabling the success of these growing industries. To promote our work in these areas, we launched a new sales incentive program to accelerate business adoption of these connectivity solutions and amplify our annual emissions reduction impact.
Optimizing Renewable Energy
Our partnership with Intellastar advances AT&T’s Gigaton Goal by leveraging cutting-edge IoT connectivity and artificial intelligence (AI) analytics to optimize energy use, lower costs and reduce emissions at industrial and commercial facilities.
Intellastar technology strengthens renewable energy and storage by:
- Continuously monitoring a facility’s energy systems and utility grid conditions to optimize energy use and on-site generation in real time.
- Predicting demand, identifying demand response opportunities, optimizing renewable output and automating load management.
- Coordinating distributed energy resources (DERs) like solar, batteries and EV chargers to reduce grid dependence, cut emissions and lower costs.
Helping Customers Track Their Network Emissions
In 2025, we enhanced our Network Emissions Allocation (NEA) tool to provide customers with clearer insights into the emissions associated with the AT&T services they use. Using detailed service-level data and industry standards, the NEA shows customers exactly how network emissions are allocated to their services. This helps customers confidently track, report and manage their carbon footprint to support their sustainability goals and emissions reduction targets.
Supporting Collective Action
In 2025, we continued our Resilient Communities Initiative work, including supporting Santa Cruz County Long Term Recovery Group (SCCLTRG) in California with a $30,000 contribution to further the adaptation strategies in the County’s Hazard Mitigation Plan. SCCLTRG is a collaboration of nonprofit organizations that work together to assist community members as they recover from natural disasters. SCCLTRG will use the grant money for weather radios, community training and wildfire prevention. By equipping local governments with actionable insights, this initiative helps them proactively protect their communities and target priority areas for risk mitigation solutions.
Learn how we’re further leveraging data to enhance our understanding of heat-related human impacts in our Environment, Health & Safety Compliance issue brief.

2025 Data
Efficiency & Emissions Data
Greenhouse Gas Emissions
| 2022 | 2023 | 2024 | 2025 | |
|---|---|---|---|---|
| Global carbon footprint (Scope 1, 2(MB) & 3 in MT CO2e)87 | 18,908,275 | 15,233,085 | 12,689,148 | 11,666,888 |
| U.S. carbon footprint (Scope 1, 2(MB) & 3 in MT CO2e)8 | 17,901,301 | 14,811,085 | 12,689,148 | 11,187,196 |
| GHG emissions intensity (Scope 1 & 2(MB) in MT CO2e/ billion dollars of revenue)8 | 39,574 | 34,537 | 33,913 | 30,521 |
| GHG emissions intensity (Scope 1 & 2(MB) in MT CO2e/1,000 subscribers)89 | 32.89 | 28.22 | 26.70 | 24.05 |
| Scope 1 GHG emissions (MT CO2e)8 | 917,036 | 643,346 | 545,052 | 526,205 |
| Scope 2 market-based GHG emissions (MT CO2e)8 | 3,861,164 | 3,585,008 | 3,603,725 | 3,308,746 |
| Scope 2 location-based GHG emissions (MT CO2e)8 | 4,962,516 | 4,816,513 | 4,479,117 | 4,553,005 |
| Scope 3 GHG emissions (MT CO2e)87 | 14,130,075 | 11,004,731 | 8,540,371 | 7,831,937 |
For information on how we calculate our emissions see the AT&T Basis of Calculations of Greenhouse Gas Emissions Data.
Related Key Topics

- Circularity Framework
- Product Life Cycle
- Operational Waste

- Philanthropic Giving
- Volunteering
- Disaster Response

- Renewable Energy
- Energy Efficient Projects
- Energy Management Platform

- EHS Framework
- Governance
- Employee Awareness

- Biodiversity
- Water Management
- Paper Procurement

- Network Expansion
- Driving Resilience
- Business Continuity

- Supply Chain Resilience
- Supplier Sustainability
- Supplier Inclusivity
-
Scope 1 emissions include direct emissions from sources owned or controlled by the company (such as fleet). Scope 2 emissions include indirect emissions that result from the generation of purchased electricity, cooling and steam.
- Scope 3 emissions are indirect value chain emissions that are neither produced directly by a company nor the result of activities from owned or controlled assets.
- A gigaton amounts to about a fifth of all U.S. GHG emissions in 2020. Calculated using U.S. Environmental Protection Agency (EPA) data, https://www.epa.gov/ghgemissions/inventory-us-greenhouse-gas-emissions-and-sinks.
-
Science Based Targets initiative (SBTi)-approved goal.
- Inclusive of global Scope 1, 2 and 3 emissions.
-
Includes grid transmission and distribution loss.
-
2024 emissions value has been restated due to adjustment in data methodology.
-
ERM CVS provided limited independent assurance of Scope 1, Scope 2 (location and market-based) and Scope 3 GHG emissions. See our 2025 Independent Limited Assurance Report for more information.
-
2022-2024 intensity data has been restated to align with updated subscriber categories in AT&T earnings reports. Intensity metrics relative to our total number of subscribers include broadband connections, AT&T Mobility subscribers and Mexico wireless subscribers, as identified in our fiscal year 2025 Form 10-K, is the denominator and is a proxy for our production.